Analyze Your Practice’s Operational and Financial Performance With KPIs
KPIs (key performance indicators) help you take the emotion out of making informed decisions as you plan the future of your practice. Collecting data and analyzing it at specific periods throughout the year will give you a clear picture of the state of your operational and financial performance.
If you work with Fuel Medical to manage your KPIs, you’ll notice that we use 18 data points when analyzing your practice, but which of those will make the most impact? This Ask Fuel First section answers the following question: Which three KPIs are the most impactful for my practice?
Numbers Tell a Story
Tracking KPIs can be quite enlightening. We find that when some practices start collecting data and get to the analysis phase, they’re shocked to see how they relate to similar-sized practices, especially if they’re performing in the bottom 20%. Initially, they probably thought there weren’t any major concerns or red flags with the business, hence the shock.
Adria Pazour, Regional Manager at Fuel Medical, said the following about KPIs:
Numbers tell a story. It helps if practices are curious so we can show them how they compare to other practices. But more importantly, practices can compare their performance with their own historical data from the year before. Did they have losses or make gains? Why? It’s the ‘why’ that helps them build realistic goals for the next year.
A. Pazour, personal conversation, 8/2023
KPIs answer the following questions, “What are we doing well and what can we improve?” Don’t get this confused with “Why do we do what we do?” We know that many healthcare professionals’ purpose is to help others; however, some people get nervous when we talk about the business aspect of ENT and audiology practices because they feel it detracts from their purpose. We like to remind our members that turning a profit keeps their businesses open so they can continue serving others. When you track KPIs and then use them to benchmark yourself with similar practices, you are able to discover what is and isn’t working, you’ll be able to fine-tune your goals, such as bringing in another audiologist or taking the leap to open a new location, which is a win-win for the practice and your patients.
So, what IS your practice doing well and where can you improve? How can improvements impact profitability and/or efficiency? Small improvements can have huge financial and operational impacts, so knowing those areas that provide an opportunity for improvement is critical for both managers and employees. Having worked with hundreds of ENT and audiology practices nationwide, we’ve found several areas where KPI data can be quite impactful. These are three KPIs to consider.
# 1. Conversion Rates: Hearing Test to HAE/CNA & HAE/CNA to Purchase
The hearing aid patient journey starts when they make an appointment. After that, each patient’s journey varies. Some will have a hearing test and follow-up appointment to fit hearing aids. However, for others, the journey may stop with the initial appointment. The difference between those who continue to pursue hearing loss treatment and those who don’t can be for a number of reasons, such as having normal hearing or coming in for a chief complaint other than hearing loss.
For patients with hearing loss, your goal is to help them get the help they need. When you evaluate their hearing, you have an opportunity to bring them back for a hearing aid fitting. That’s what we mean by conversion rate—you convert a patient from the point of being aware of their hearing loss into a working with you to treat their hearing loss with hearing aids.
The financial impact of improving your conversion rate can be exponential. For example, if an audiologist converts two appointments per month, they’ll be able to generate $27,000 in profit annually. This number doubles if two audiologists convert two appointments per month, and so on. If your practice’s conversion rate is in the bottom 20% when compared to similar practices, but you move it to the median category (50-67%) by generating 10 additional hearing aid patients annually, you’ll see $22,000 in additional profit per year per audiologist. Converting hearing aid evaluations into hearing aid purchases increases your efficiency at moving patients into treatment plans as well as your business’s profitability.
Fuel Medical can help you track your success in converting appointments as a group and individually. If your staff sees a lot of patients but isn’t converting appointments, you’re missing opportunities to grow your business. And the data will show it. Once we know this KPI is an area of concern, your regional team can provide recommendations for improvements.
#2 Return Rate
If making the decision to pursue treatment and purchase hearing aids is the first step, deciding to keep them is the second. Typically, patients have between 30-45 days to return a device, depending on state laws and manufacturers’ policies. When you keep your conversion rate high, you must also pay attention to the return rate.
After being convinced that wearing hearing aids improves their health in the office, patients may feel differently once they get home. Instead of working with your providers to adjust or fine-tune the hearing aids, some will inevitably just return them.
The normal return rate ranges between 3-12% of sales. If 4% of the hearing aids you sell are returned, you’re on the lower end of the healthy range. But if you’re seeing closer to 12% of hearing aids being returned, you should start understanding why patients are returning their hearing aids to spot any potential patterns that might be correctable. Is it a particular provider or model of hearing aid that is having more returns than others? Are there complaints regarding cost?
It’s in your interest to keep your return rates low. For example, improving your return rate from 13% to 6% means you will retain over $12,000 in annual profit per audiologist. Fuel Medical can provide recommendations to minimize returns, such as providing patient education, pricing analysis or helping practices develop a thorough aural rehabilitation process.
#3 Average Sale Price of Hearing Aids
The average sale price (ASP) of hearing aids directly impacts your practice’s success. This is another subject that often makes people nervous, but it’s one that’s necessary to discuss. You can measure how close you are to current benchmarks by tracking ASP through KPIs.
For example, the median ASP per unit across the country is currently $2,162. A full-time audiologist at an ENT clinic usually dispenses about 11 units a month. Sometimes, that number fluctuates, depending on how busy the practice is and if the audiologist took some time off, but generally, most audiologists dispense 11 units each month. If we multiply the median ASP of $2,162 by 11, we get $23,782 of average monthly hearing aid sales per audiologist. This is the benchmark for ENT practices nationwide.
We break benchmarks into three segments: bottom 20% performers, mid-range performers and top 20% performers. These benchmarks vary depending on practice size and type, such as a single-specialty practice with a couple of audiologists, a large ENT practice with multiple locations or a university or non-profit clinic. Your Fuel Medical regional team can help you identify practices with similarities to yours to give you an idea of where you fall within the performance range.
For practices that discover they’re in the bottom 20% of performers compared to similar size and type practices, could this be because their ASP is too low? For example, if you’re an ENT practice selling hearing aids at $1,700 because this is the price that you’ve been selling them at for the last 5 years, you could be missing an opportunity. Let’s say an audiologist working at the practice sells an average of 11 units a month; their sales will be $18,700. That’s over $5,000 a month and just under $61,000 a year in lost revenue per month per audiologist. Of course, that number increases with more audiologists on staff. Some practices get nervous about raising their prices, but we know from behavioral economics trends and experience that selling devices at industry averages, even if that means you need to charge more, doesn’t equate to a loss in business. Patients will still buy from you.
Some of our members believe that if they increase prices, they won’t be able to sell as many units. We found that this isn’t generally the case. Patients know that prices are increasing in health care, including the hearing health industry. Increases aren’t a huge shock. If you keep up with industry averages, you’ll find that your average number of sales won’t change much, but the revenue brought in will increase dramatically. If there are some patients who struggle with the price increase, there are other options, such as selling last year’s models at a lower price through the Access Hearing program or guiding them to manufacturer promotions.
If you find that you are in the top 20% of performers, you’ll undoubtedly be looking for ways to stay competitive. That means keeping in contact with your Fuel Medical regional team to analyze your KPIs periodically and find ways to grow.
Why Is Knowing A Benchmark Helpful?
Let’s say you want to invest in new equipment. Maybe you want equipment with newer technology, or you’re an ENT practice considering purchasing new audiology equipment. You aren’t sure this is a good investment because you don’t know how long it will take for you to recoup the cost of that equipment.
David Sweet, Regional Manager at Fuel Medical, said this about helping practices in the northeastern part of the US with benchmarking:
This formula [for calculating ASP] is what I use when helping an ENT practice start an audiology department from scratch. They’re trying to figure out if investment in all of this audiology and hearing aid programming equipment will pencil out. A lot of ENT practices outsource hearing aid dispensing to an outside company, but they don’t have to. I can help them determine if their investment is worth the risk. And oftentimes it is.
D. Sweet, personal conversation, 10/2023
If you’re tracking ASP, your Fuel Medical regional team can help you determine that information. They’ll calculate the ASP of units sold according to the number of audiologists at your practice. This number minus expenses will provide a rough idea of how much you can pay towards the equipment each month and how many payments are necessary. There’s much more that goes into determining ASP and which benchmarks are appropriate for your practice, and your regional team is ready to support you.
18 Key Metrics
We’ve just mentioned three important KPIs to consider, but there are many more (see Table 1: Key KPI Metrics). Metrics, such as net HA revenue, margin/gross profit and binaural rate (the number of units sold in pairs compared to single units per patient), give you a better picture of your practice’s potential for growth in the future.
Table 1. Key KPI Metrics
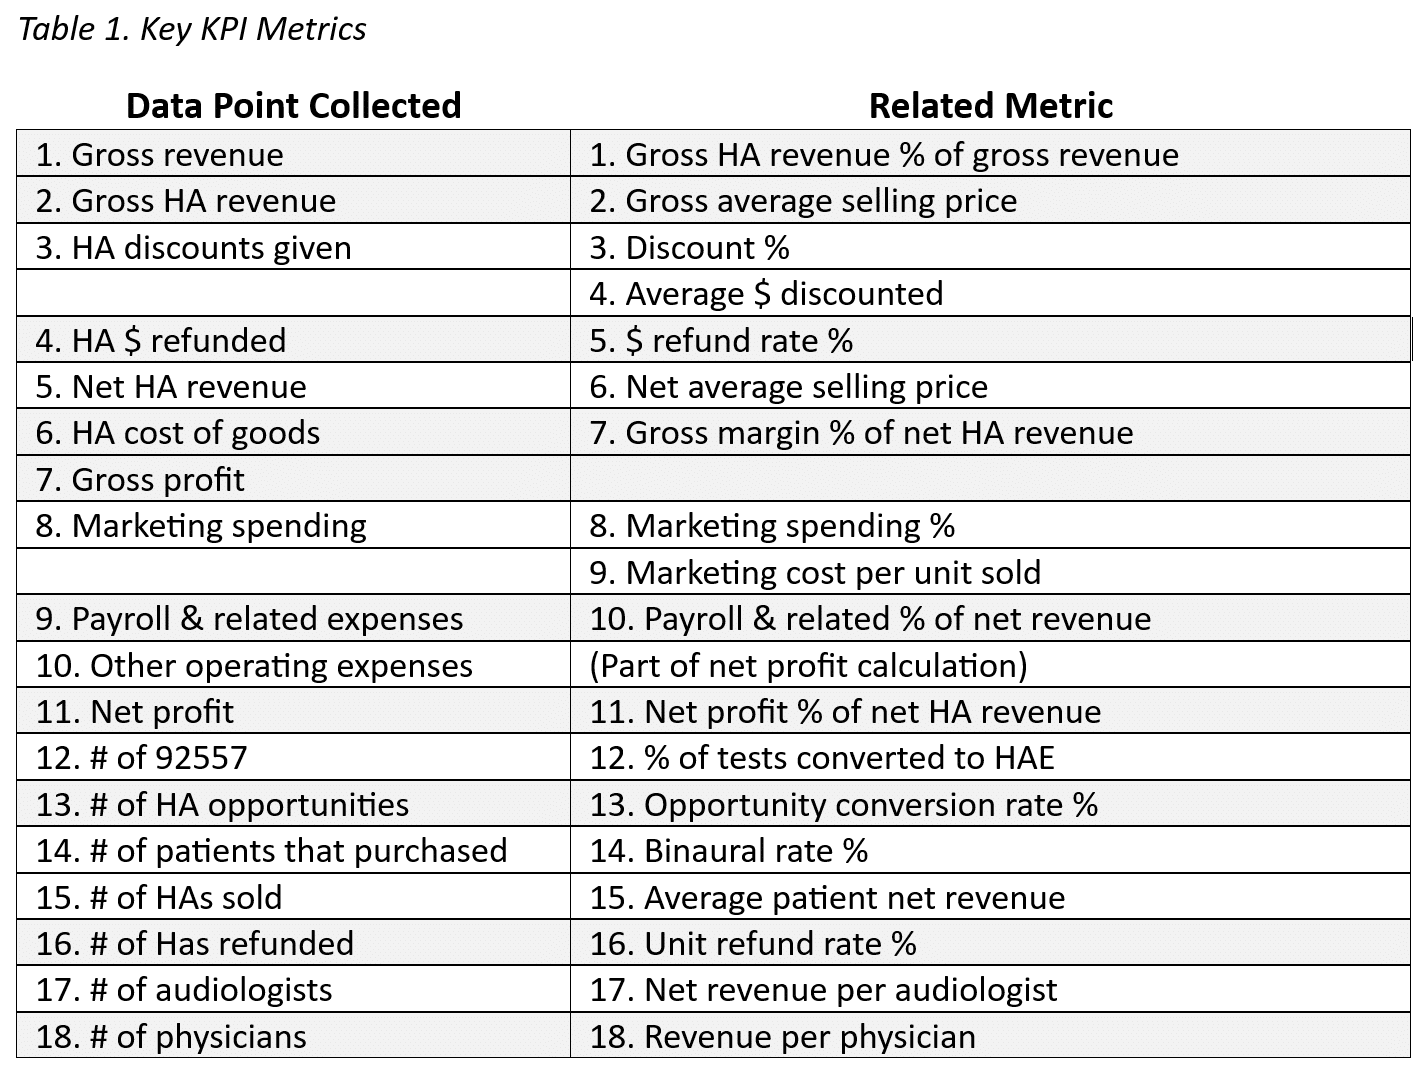
Many of our members find KPIs confusing, so after many years of explaining how KPIs benefit every practice, regardless of size, our regional teams have become adept at explaining them in a way that anyone can understand. So, what are you waiting for? Let us know how we can help you today.
References Hong, J. Y., Oh, I. H., Jung, T. S., Kim, T. H., Kang, H. M., & Yeo, S. G. (2014). “Clinical Reasons for Returning Hearing Aids.” Korean Journal of Audiology, 18(1), 8–12. https://doi.org/10.7874/kja.2014.18.1.8