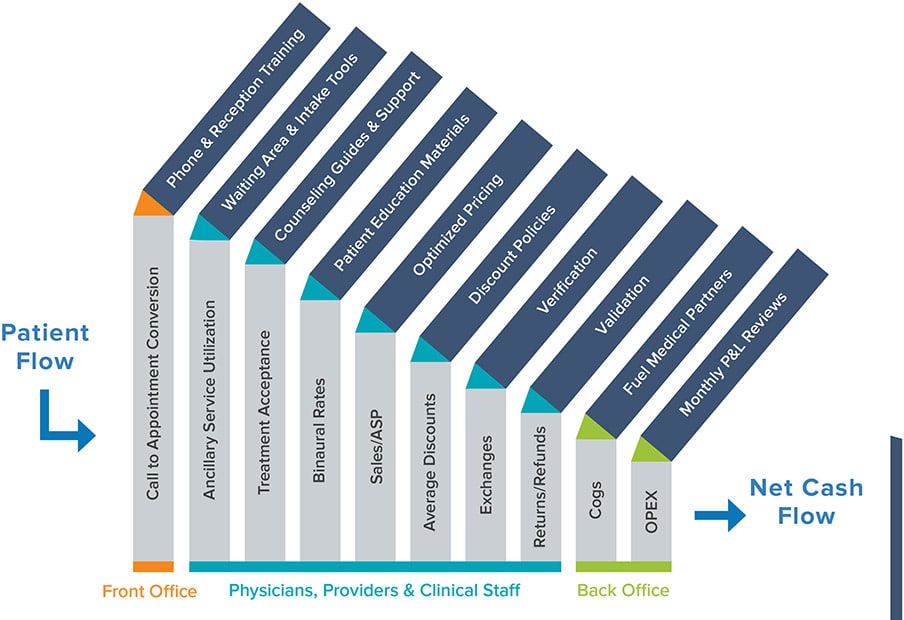
Fuel Medical is committed to improving your fiscal performance. One critical component in achieving that goal is reviewing your performance and operational data. This data provides us with an objective set of decision making criteria we call Key Performance Indicators (KPIs). Many businesses like yours either do not have the time or tools to efficiently track, analyze and interpret the key drivers of their business. This article provides some simple ways data can be gathered from a number of information systems and converted into a meaningful set of metrics for comparison against current targets, historical performance and “Best Practice” benchmarks for your audiology department. The chart below displays how fiscal performance can be tied to specific activities inside your clinic.

Think about KPIs like you think about the instrument panel in your car: they alert you to potential pitfalls related to efficiency and performance, then point you in the right direction to address and improve the areas of greatest need. Along the same line, information in this article should be similar to that of a vehicle owner’s manual – you don’t need to memorize it, but keep it nearby for reference. At Fuel, we focus on 18 key metrics and use collected data to identify target ranges for our members. When any of the 18 metrics falls outside the desired target range, we diagnose the problem but also identify solutions to positively impact your bottom line.
The numbers collected each month populate an easy to read “Executive Summary,” which visually captures your operational and financial performance. The reports will show how your business is doing monthly, year-to-date and annually, and how your numbers compare to both the previous year’s and your current year’s targets. We are happy to assist you with the data extraction process. We can populate the majority of these metrics using a monthly P&L and a detailed hearing aid transaction report. We can also provide manual tracking sheets in a user-friendly Microsoft Excel document if you do not currently have access to a hearing aid detail report.
Not sure where to start? We can help. Complete the Financial Profile survey below and your regional manager will be in touch with you.
Sample Practice
Analysis of 92557 Procedures & Estimated Hearing Aid Revenue
Though most practices have access to their key data points, they don’t always know what to do with them. And even after collecting your data and identifying personal benchmarks, it serves little value with no context-but that’s where Fuel Medical can help. Not only will we help you understand the metrics and where you fit in, industry-wise, but we also help identify and diagnose areas in need of improvement. Whether it be addressing low close rates or provider specific ASP, Fuel has best practice strategies to identify opportunities for growth and improvement.
If you’re interested in seeing the impact of a slight increase in monthly unit average from 11-14 units per month per audiologist and the small improvements made in number of 92557s, close rate, binaural rate and ASP that ultimately resulted in an additional $101k annual revenue PER AUDIOLOGIST, complete the contact form below.


